Using DataviewJS to dynamically create multiple tables
I have written in the past about how I use the Dataview plugin in Obsidian to create tables and lists from content. Lately, I have also been looking into the DataviewJS functionality. Here, rather than SQL scripting, you can use the full power of JavaScript to create even more advanced automations.
In this article, I will discuss how to use DataviewJS to create multiple headings and tables in a row from a single Dataview embed.
On the Dataview plugin
The Dataview plugin allows you to create tables and lists from existing content. This is similar to apps like Notion.
Let's say you are a researcher or student and have lots of notes on existing literature, each tagged with #literature . Now, wouldn't it be ideal to automatically create a list from all papers, maybe also showing their publication year and conference venue?
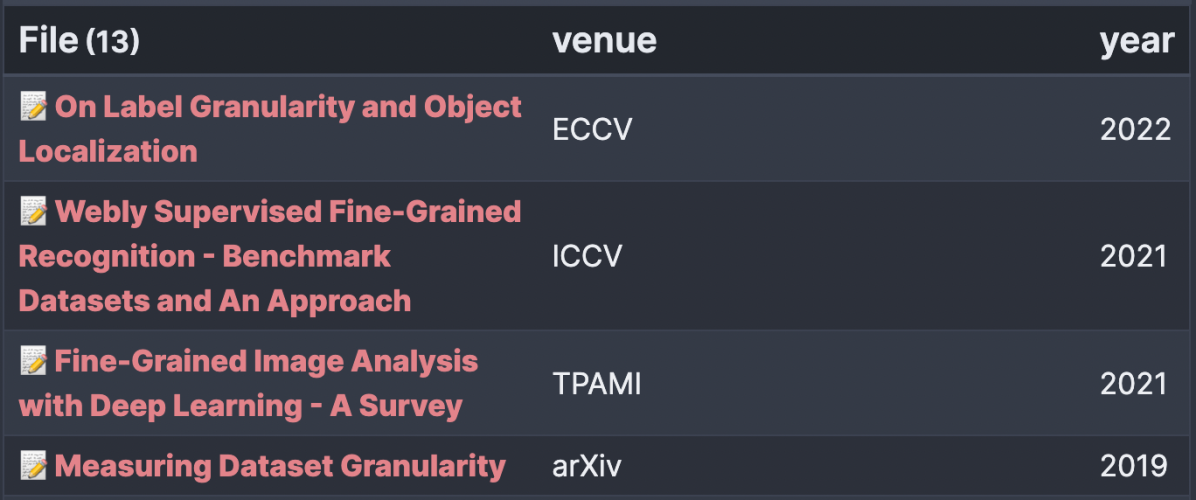
For each note, you can tag it as #literature. Further, you can add some extra information such as year:: 2022 or venue:: CVPR. Now, Dataview allows you to plot out a table of all your relevant notes. Simply create a block like this:
```dataview
TABLE venue, year FROM #literature SORT year DESC
```
And Dataview will embed this dynamic table, which also updates automatically when you add new notes:

You can play around with which columns you want to show (add other fields between TABLE and FROM, and other stuff.)
Now, this is already tremendously useful, but this article wants to dig further and discuss a more advanced mode called DataviewJS.
What's DataviewJS?
The example above shows the normal dataview syntax which is similar to something programmers call SQL. Essentially you tell the plugin to create a table from existing fields based on a query. Like shown before, we want fields X and Y from tag Z.
With DataviewJS, it further allows to do scripting on top of it. This gets much more complex and the syntax changes, but it then also allows for more dynamic automations. I'll illustrate:
Let's say you don't have #literature as a tag, but rather a nested tag of #literature/paper , #literature/video, #literature/web, and so on.
You could use Dataview to let it create a table for all #literature, which might be fine. However, it might get very long and difficult to find entries in. Overall, papers, videos, and web articles are different sources, so it might better to have multiple tables instead?
Now, you could create headings for each subcategory and then one dedicated table under each. However, if you now create a new tag called #literature/podcast, you need to update it and add a new heading and table. Wouldn't it be nice to automatically create an overview of all used nested tags, including headings and tables for each?
Here comes DataviewJS. Using scripting functionality of JavaScript, you can tell it to do exactly this.
Requirements
For this workflow to work, you need multiple things. Of course, a current version of Obsidian with the Dataview plugin need to be installed. If you have never used those before, you might first want to get comfortable with those, as DataviewJS is a bit complex and might overwhelm you at first. I have some other articles around Dataview which are a bit more straight-forward.
Also, you need to activate "DataviewJS query" support in the Dataview settings:

Back to the example
I will start with the example code:
```dataviewjs
let pages = dv.pages('#Literature');

for (let group of pages.groupBy(b => b.tag)) {
  dv.header(3, group.key);
  dv.table(["Name", "Venue", "Year", "Authors"],
    group.rows
      .sort(k => k.year, 'desc')
      .map(k => [
        k.file.link,
        k.venue,
        k.year,
        k.authors
      ]
    )
  );
}
```
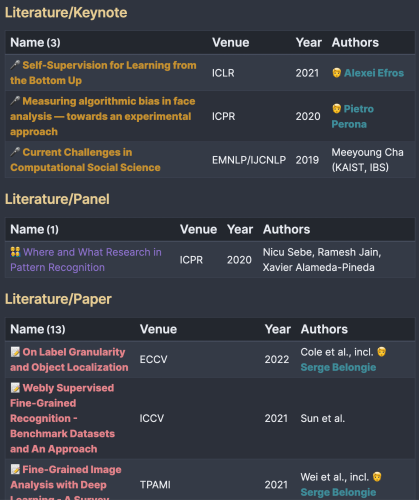
This will:
- Grab all notes with the tag
#Literature - For each nested tag:
- Write a heading for this nested tag (E.g., "Literature/Paper")
- Write out a table for this nested tag
The result looks something like this:

Now, if there's a new nested tag like #Literature/Podcast, the overview page will automatically adjust and add a new heading + table for this one too.
Unfortunately, while Dataview is pretty well documented, DataviewJS is less documented and a bit harder to work with, especially if you are not experienced with programming. Maybe start by copypasting my example code and try to adjust it to your own notes.
I will try to discuss the most important lines below. However, if you need some further instructions, don't hesitate to write a comment below! I can try help you or write a follow-up article.
Some more explanations on how this works
While standard Dataview is a query language, DataviewJS is JavaScript. This means, Dataview itself is basically just instructing Dataview "what to look for". In contrast, DataviewJS will "run code" line by line, eventually plotting out some results.
You will start with something like this, which instructs the code to 'grab all pages with the tag Literature':
let pages = dv.pages('#Literature');This by itself does not do anything, it will simply pull all related notes into the variable "pages" in order to be used later.
Next, we will do a "for" loop, which basically means we ask it to repeat some code "for each instance of something". If we want to let it write out text "for each page" it could be a simple for (let page of pages).
In our example, we want it to run once for each nested tag. pages.groupBy(b => b.tag) is a nasty syntax to tell it: split out all pages we have, according to their nested tags. I.e., it will split out #Literature/Paper and #Literature/Video and then run the code below it for each nested tag seperately.
for (let group of pages.groupBy(b => b.tag)) {
  ...
}
Now that we have this, it will run everything between { and } for every nested tag.
Next, we will let it plot out a heading:
dv.header(3, group.key);"3" basically means a third-level heading (so what you get when you type "### Something"). The group.key comes from the let group of part. In this case, it will contain the name of the nested tag.
Lastly, we will print out our table. The dv.table command is pretty close to what a Dataview TABLE query would do. Keep in mind it will use a completely different syntax, so something new to learn...
Anyway, the first argument is the list of all columns: ["Name", "Venue", "Year", "Authors"]. In this case we will plot out four columns: Name is the title of the note and Venue/Year/Authors will be filled by the corresponding meta-data we added to each note.
The second argument is what it should plot: group.rows will tell it "use all papers in our current group. I.e., this is all papers for the nested tag we just printed a heading for.
The .sort is the syntax to tell it which field to sort for. The .map will finally tell it which note field will be put into which column. This does not correspond to the column names but just their order. The full table will look like this:
dv.table(["Name", "Venue", "Year", "Authors"],
  group.rows
    .sort(k => k.year, 'desc')
    .map(k => [
      k.file.link,
      k.venue,
      k.year,
      k.authors
    ]
  )
);
Now we are finished with our example. It will grab all pages within the basic #Literature tag, then split out each nested tag into seperate runs of the for-loop. Then it will print a heading and a table for each different nested tag.
Other use-cases
This way of automating Dataview tables is very powerful. I use it a lot for automating minor stuff in my Obsidian vault. Some ideas:
- Above I split Literature into different categories like "Paper"/"Web"/"Video". You can use a similar approach to split them: by author, by year, by venue, by keywords. Actually in my "Literature overview" file, I have multiple such DataviewJS embeddings where I plot it in various ways. This allows for very easy browsing of my note database.
- If you have things like meeting notes, you can use DataviewJS to create overviews by month or by team.
- I have a list of students and colleagues across different universities and institutions. I use an approach like this to create headings and tables of students and colleagues "for each university".
Further reading
While maybe not enough for JavaScript novices, the Dataview documentation contains a reference page for the DataviewJS functionality. There's also a list of examples.
There is also a very lengthy thread in the Obsidian forums called "DataviewJS Snippet Showcase", which is ideal for further inspiration or seeing how other people use this feature.
Disclosure: This post may contain affiliate links. This means I may make a small commission if you make a purchase.
About me

Marc
I am a lecturer in field of computer science. I am interested in task- and knowledge management. Sometimes, I blog on productivity workflows, apps, and other related non-work stuff I'm working on.
See Also
Exporting Markdown from OmniOutliner
Both for my day job as a researcher, as well as for this website, I often prepare papers and articles by first writing an outline. In an …
Read More...How I connect DevonThink and Obsidian
For knowledgement I am using a combination of Obsidian and DevonThink. Why two apps? Well, I like to keep text notes (mainly "my own …
Read More...Evernote web clipping plus todo lists as read-later tool
There are often things you read in web, which are actually interesting, but just come in the wrong moment. Directly before a meeting, or …
Read More...